• Statskom Twitter
  • Statskom LinkedIn
  • Statskom RSS

Statskom

  • Home
  • Services
    • SDTM conversion
  • SAS Training
    • Introduction to SAS
  • Products
  • SAS Blog
  • About us
  • Contact
  • Navigation

SAS tips & tricks #4 – Visualising SAS datasets with an sql histogram

In our last post SAS tips & tricks #3 – SAS dictionary tables, we looked at how the dictionary tables can be used to find metadata about the SAS session, including dataset and variable level metadata.

In this post we look at how we can use a simple piece of SQL to create a histogram which gives a quick overview of the number of variables in each domain.

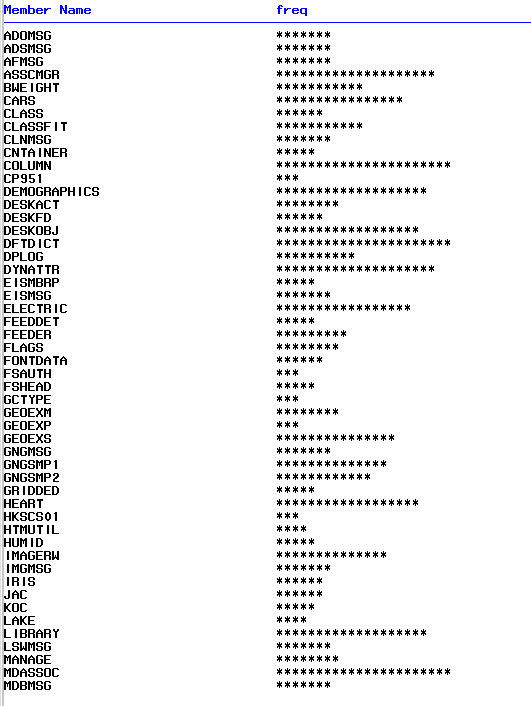
The SASHELP.VCOLUMN dataset contains a list of all variables present in each dataset. Here we use the repeat function to output a “*” character for each variable in the dataset. The output of the query is printed to the active output destination.

PROC SQL;
   SELECT memname  , REPEAT('*',nvar) AS freq
   FROM sashelp.vtable
   WHERE libname = "SASHELP";
 QUIT;

The result is something similar to the below, which gives a quick insight into the number of variables in each dataset in the SASHELP library.

sql_histogram_vars

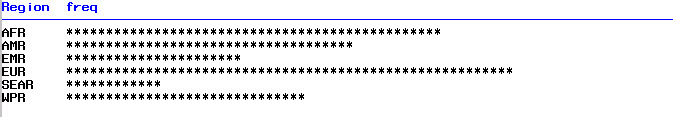
This SQL histogram technique has a wide varierty of other applications, for example here we use it to show the frequency of countries within each region in the SASHELP.DEMOGRAPHICS dataset.


PROC SQL;
  SELECT region , REPEAT('*',COUNT(*)) AS freq
  FROM sashelp.demographics
  GROUP BY region
  ORDER BY region;
QUIT;

sql_histogram_region


Tagged on: histogram, metadata, PROC SQL, SAS
By Andrew N | 28/08/2014 | SAS Tips & Tricks | 1 Comment |
  • ← SAS tips & tricks #3 – SAS dictionary tables
  • SAS tips & tricks #5 – NOTE: The query as specified involves ordering by an item that doesn’t appear in its SELECT clause →

1 comment on “SAS tips & tricks #4 – Visualising SAS datasets with an sql histogram”

  1. J. Edou 09/10/2014 at 18:43

    Thanks, this is very useful and concise.

    Reply ↓

Leave your comment Cancel reply

Your email address will not be published. Required fields are marked *

You may use these HTML tags and attributes: <a href="" title=""> <abbr title=""> <acronym title=""> <b> <blockquote cite=""> <cite> <code> <del datetime=""> <em> <i> <q cite=""> <strike> <strong>

Search

Calendar

December 2023
M T W T F S S
« Oct    
 123
45678910
11121314151617
18192021222324
25262728293031

Latest posts

  • Clinical Metadata – PhUSE conference paper abstract
  • Clinical Metadata at Phuse next week
  • Clinical Metadata can help you manage your clinical trial metadata and achieve CDISC compliance
  • Phastar SAS art competition
  • NYC Marathon Statistical Analysis

Categories

  • CDISC (2)
  • CDISC training (1)
  • Clinical Metadata (1)
  • Data analysis (1)
  • Introduction to SAS (1)
  • Kaggle (3)
  • News and events (3)
  • SAS learning edition (2)
  • SAS paper review (7)
  • SAS Tips & Tricks (11)
  • Uncategorized (3)
  • Statskom Twitter
  • Statskom LinkedIn
  • Statskom RSS
Copyright © 2023 Statskom  |  Contact us  |  Site developed by Uchenna
Back to Top