
This is the first of our tutorials on using SAS university edition to explore the data from the Kaggle Titanic: Machine Learning from Disaster edition. The tutorial is designed to be roughly equivalent to the first excel lesson available on the Kaggle website. It should be useful both for people who want to learn SAS, but also for those who want to use SAS to enter the Kaggle competition. It explains how to use the SAS University Edition to do the following:
- Reading a CSV file into SAS using PROC IMPORT.
- Calculating the proportion of men and women who survived using PROC FREQ.
- Using IF…THEN..ELSE logic to modify a dataset.
- Using the KEEP statement to only keep variables that you want in your dataset.
- Outputting a dataset to a CSV file in preparation for submitting it to Kaggle
Before you get started you will need to install a virtual machine and then the SAS university edition files. If you haven’t done this yet that you can follow the tutorial here.
Now launch the virtual machine and log onto the SAS University Edition.
Download the train.csv and test.csv file from the Kaggle website and store them within the shared folder you setup when installed SAS unviersity edition, usually this will be : C:\SASUniversityEdition\myfolders\ .
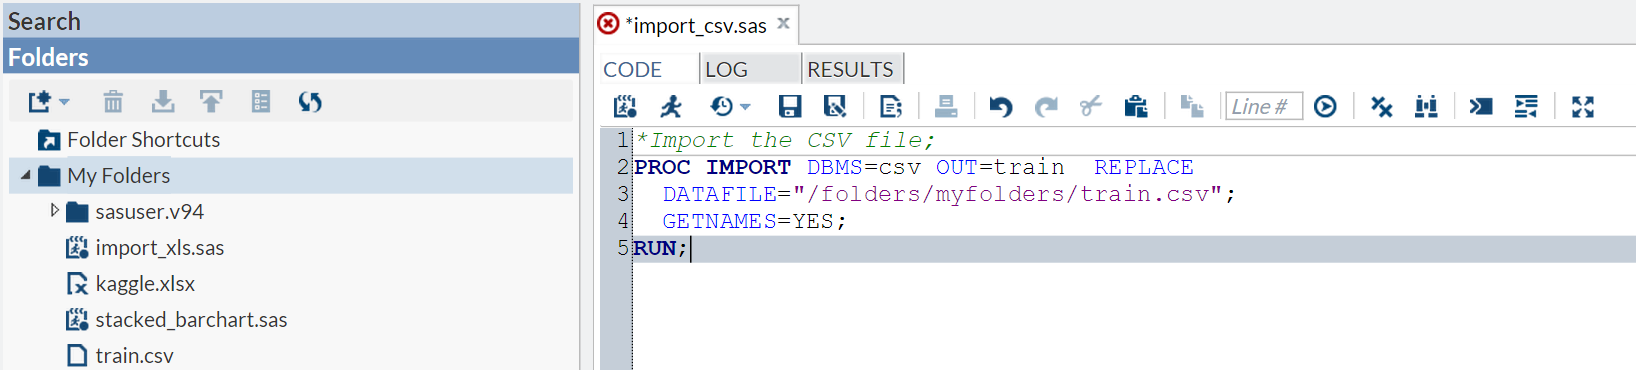
Now we will import the train.csv file. To import the CSV file, we will use the PROC IMPORT procedure. Enter the following code into the code window as shown below.
PROC IMPORT DBMS=csv OUT=train  replace
  DATAFILE="/folders/myfolders/train.csv";
  GETNAMES=YES;
RUN;
- Here the DATAFILE option tells the procedure the name and location of the input file (note how this is relative to the shared folder you setup when you installed SAS University Edition).
- The DBMS option tells the procedure the type of file it will be reading.
- The OUT = option gives the name of the output file, as we are not specifying a LIBREF this dataset is created in the work library.
- The REPLACE option tells the procedure that if the TRAIN file already exists in the work library then it should be overwritten.
- The GETNAMES option tells the procedure that the first row of the CSV file contains the values that will be used to label the variables in the TRAIN dataset.
Execute the code by pressing F3, or by clicking on the little running man.
The program will import the CSV file into SAS and convert it to a SAS dataset. The log file will show something similar to the below, confirming that the import was successful, it will also have information on the variables which have been created.
891 rows created in WORK.TRAIN from /folders/myfolders/train.csv.

 NOTE: WORK.TRAIN data set was successfully created.
 NOTE: The data set WORK.TRAIN has 891 observations and 12 variables.
 NOTE: PROCEDURE IMPORT used (Total process time):
       real time           0.17 seconds
       cpu time            0.18 seconds
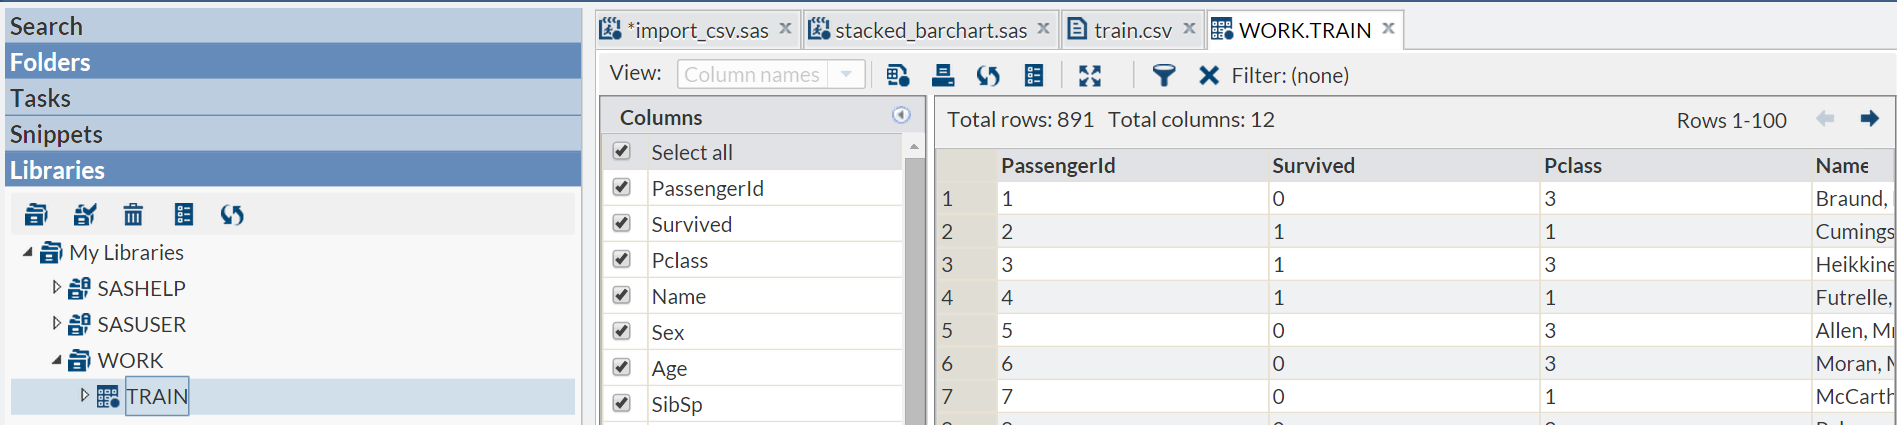
To check that the import has worked as expected, open the train dataset within the work library as shown below.
Next we look to see what effect the gender of the passenger has on their chances of survival. To do this we use the PROC FREQ procedure as follows:
Enter the following into the code window, highlight it and execute the block of code either with the F3 key or by pressing the running man icon.
PROC FREQ DATA =train ;
  TABLES survived*sex / NOROW NOPERCENT;
RUN;
This code produces a two way frequency table. Note that we use the NOROW and NOPERCENT options to suppress the printing of some unwanted information. The output window should automatically be shown and should display something similar to the below.
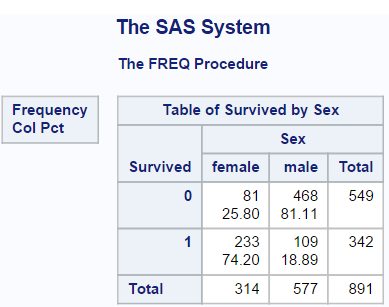
This table tells us lots of useful information.
- The bottom right number tells us the total number of passengers in the dataset (891)
- We can also see the number of females (314) and the number of males (577).
- The number of people who survived (342) and the number that did not (549)
- Most interestingly perhaps we can see the percentages of men and women who survived.
We notice that 74.2 % of women on board survived, but only 18.89% of men. It seams reasonable therefore that we might first attempt to work out which passengers from the training set survived, by guessing that all females survived and all males did not. To make a submission to Kaggle, you need to import the test.csv file, modify the dataset, output it back to a CSV file and then upload it to Kaggle, the process for doing this is explained below.
The process for importing the test.csv file is the same as the process for importing the train.csv file explained above with the exception that the file name is changed. Try to write and submit this code yourself, or scroll down to see how it should look.
PROC IMPORT DBMS=csv OUT=test replace
  DATAFILE="/folders/myfolders/test.csv";
  GETNAMES=YES;
RUN;
Next we want to use conditional programming logic to assign values to a variable SURVIVED according to the gender of the passenger. To do this we use IF…THEN…ELSE logic as shown in the code below to create a dataset called gender_submit
DATA gender_submit(KEEP=survived passengerid );
  SET test;
  IF sex = "female" THEN survived = 1;
  ELSE survived = 0;
 RUN;
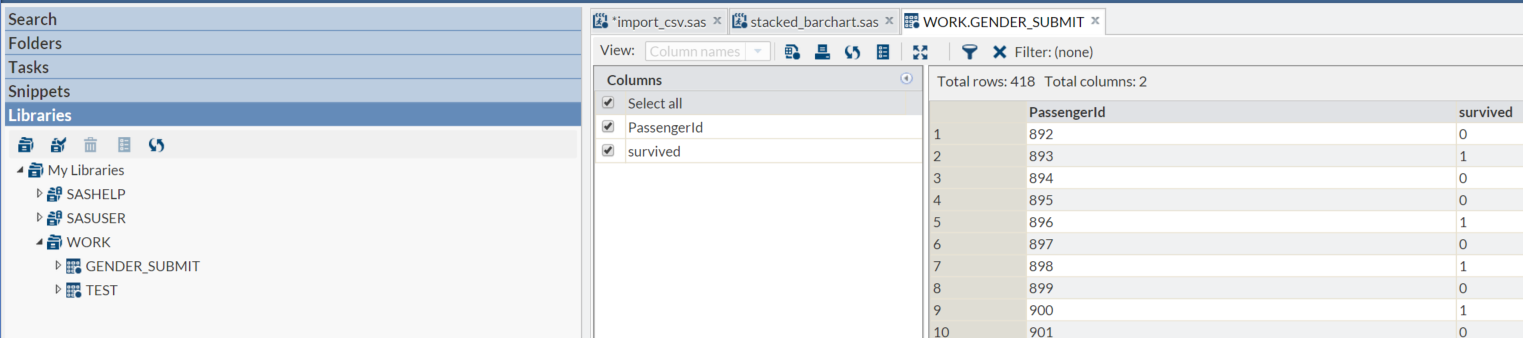
Survival in this dataset is indicated when the SURVIVED variable takes a value 1. In this example we use IF…THEN… ELSE logic to set the value of the SURVIVED variable to 1 if the sex variable = “female” and to set the value of the SURVIVED variable to otherwise. When making a submission for this challenge, your CSV file can only contain the variables SURVIVED and PASSENGERID. the KEEP statement in the first line, ensure that the output dataset only contains the variables you are interested in. To confirm this has worked as expected, open the dataset gender_submit from the work library, it should look similar to the following;
Finally you need to convert the dataset gender_submit into a CSV. This is done with the PROC EXPORT procedure as shown below.
PROC EXPORT DATA=gender_sub DBMS=csv
  OUTFILE= "/folders/myfolders/gender_sub.csv" REPLACE;
RUN;
Notice how the OUTFILE option tells the procedure where to write out the CSV file. Your shared folder should now contain the CSV file. Upload this to Kaggle and make your first submission.
The next tutorial will explain how to use graphics to explore your data further.
Thank you